i, Installation in the Fedora core could be done using yum package manager.
# yum install bootchart
ii, GRUB entry
The boot logger bootchartd will be in the path /sbin need to be started by the kernel instead of init script. This can be achieved by modifying the GURB or LILO kernel command line.
Note: Login as a root, open the /boot/grub/menu.lst with a text editor and add init=/sbin/bootchartd to kernel command line as shown below. Once you are done with that save the /boot/grub/menu.lst and reboot your Linux box.
title Fedora (2.6.29.4-167.fc11.i686.PAE)
root (hd0,1)
kernel /vmlinuz-2.6.29.4-167.fc11.i686.PAE ro root=/dev/mapper/VolGroup-LogVol01 rhgb quiet init=/sbin/bootchartd
initrd /initrd-2.6.29.4-167.fc11.i686.PAE.img
iii, Visualizing the Boot log with the Bootchart
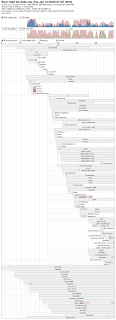
Once the Linux box is up, the Bootchart is ready with log information which is logged in /var/log/bootchart.tgz. Now its time to visualize the Bootchart. Execute the following command as a root user.
# bootchart /var/log/bootchart.tgz
The above command would generate image file named as bootchart.svgz in the current working directory. The default image format is svg if you like to generate the boot chart as png file then you need to specify the switch -f with the image format.
# bootchart -f png /var/log/bootchart.tgz
